The UN Emissions Gap Report 2023 was formally released on 20 November 2023. Advanced press emphasized that fully implementing the revised Nationally Determined Contributions made under the Paris Agreement in December 2015 would limit global heating to 2.9˚C. As pointed out in The Guardian, this best-case scenario is probably 3˚C and there is little doubt that for much of the planet this would be horrific. The impacts that I think need more emphasis are the effect of this on the drying of the bread basket of the North American Great Plains, the loss of much of the southern and southeastern Amazon Forest, and the teleconnections of this loss on such remote places as the Western Antarctic Ice Sheet (WAIS) and the Tibetan Plateau. Folks just don’t fully comprehend the degraded planet we are leaving for our kids.
The other much anticipated report that was released is the Fifth National Climate Assessment (NCA5). In a previous post I recorded my initial impressions. The report includes a rather weak attempt to capture aspects of climate equity and justice and it emphasizes big-tech carbon capture for mitigation.
The NCA5 shows that all regions of the US will increasingly suffer a variety of climate-caused disasters. The impacts have historically been felt disproportionately by less wealthy communities.
The new 2023 State of The Cryosphere report from the International Cryosphere Climate Initiative shows that catastrophic global damage to the world’s ice would result from sustained global heating above 2˚C. This would include rapid and irreversible sea level rise and commit the planet to between 12 and 20 m. Permafrost thaw would become extensive and emissions from this would significantly amplify global heating. 2˚C is much too high.
Recent studies of the WAIS indicate that loss of glaciers that are holding back major parts of the ice sheet has been rapidly accelerating. This melting is mostly from underneath the slabs of glacier ice that extend into the sea from the Ross Ice Shelf. It is possible that we can prevent the collapse of the WAIS if we act aggressively and fast to keep global heating in check.
Much, and likely most, of the carbon stored by old growth forest is below ground and through uptake by the associated forest ecosystem. In other words, when you cut down an old growth tree you are taking away a big chunk of the carbon source for the ecosystem in which the tree is growing. It is not just the carbon in the board feet in the wood that is harvested. A new review of Northern California redwood forest shows that these forests store most of their carbon above ground. Only 5 percent of these forests remain. I am willing to bet that the massive trees of the lowland Malaysian Dipterocarp Forests also store significant amounts of carbon in their tissues. Routinely these trees are 80 m tall, and about 50 trees in Eastern Sabah Forest are more than 90 m tall. They never have the massive girth of the redwoods.

Redwoods in Northern California

A species of Dipterocarpus
Andrew Dessler from U Texas has pulled up from a 2016 publication in Nature Climate Change a graph that he calls the scariest climate plot ever. The warming since the last glacial maximum about 18,000 years ago until the beginning of the interglacial about 8,000 years ago has been about 5˚C. The big jump during the Common Era is due to humans and eventually this will be about about 3˚C. Presently we are at 1.2˚C.

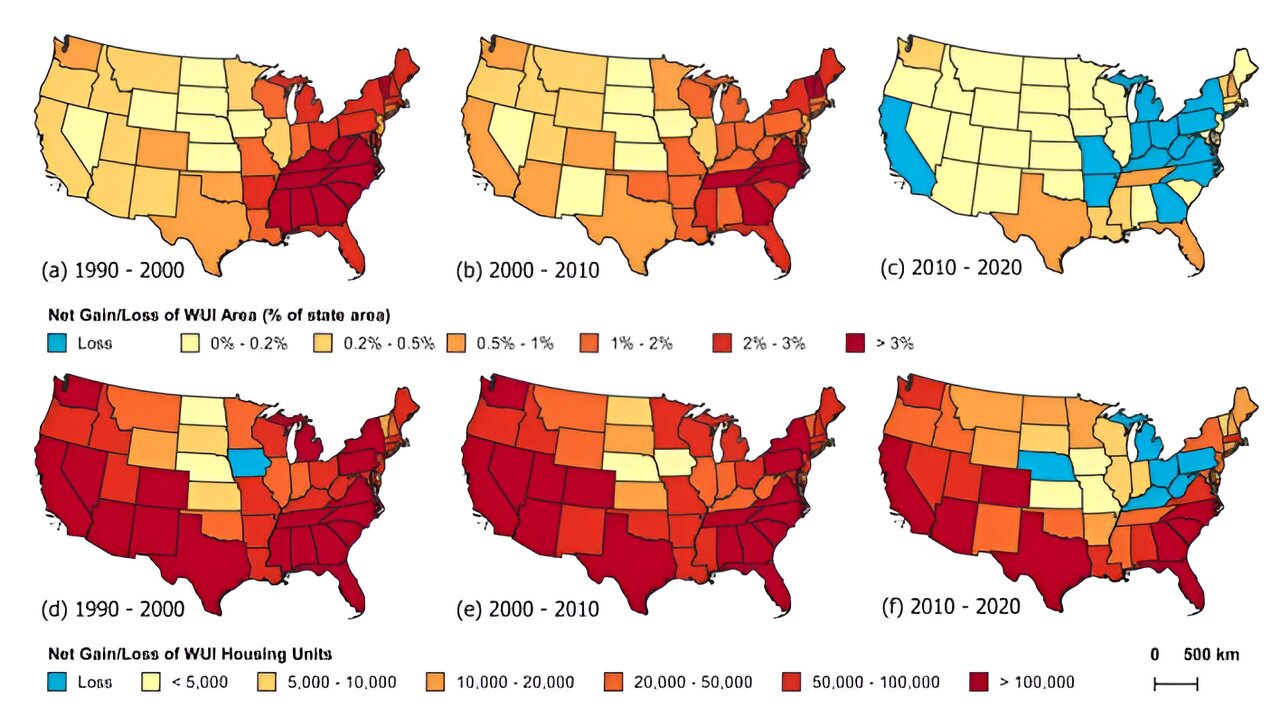
A recent study of wildfires in the U.S. shows that the number of homes destroyed has dramatically increased since the year 2000.
The richest 1% of us accounts for more emissions than the poorest 66%. The report from Oxfam is stunning for its clarity and strong data. We are allowing the despicable amoral super rich of the developed nations to rob our children of their future.
On 24 November the CO2 reading above Mauna Loa was 422.36 ppm. As pointed out in The Guardian, this is 5.06 ppm more than the same day last year for that location. This is the largest increase ever recorded for this time of the year, but a single reading on a single day does not reflect the annual flux. It is important to understand that this spike is not the global average for 2023. Much of this is due to seasonal onset of wintertime emissions, which typically run higher than the yearly average. The headline states that this represents humanity’s failure to control emissions. This is an overstatement especially when you consider the seasonality of emissions and the developing El Niño, which is likely responsible for more than 1 ppm of any increase in the average for 2023 (see the analysis in Nature Climate Change September 2016). Nevertheless, it is likely that this will be the first year in which CO2 concentrations remain above 400 ppm for the entire year.
This graph from The Carbon Project illustrates the inter-annual variation in the growth rate of atmospheric CO2.
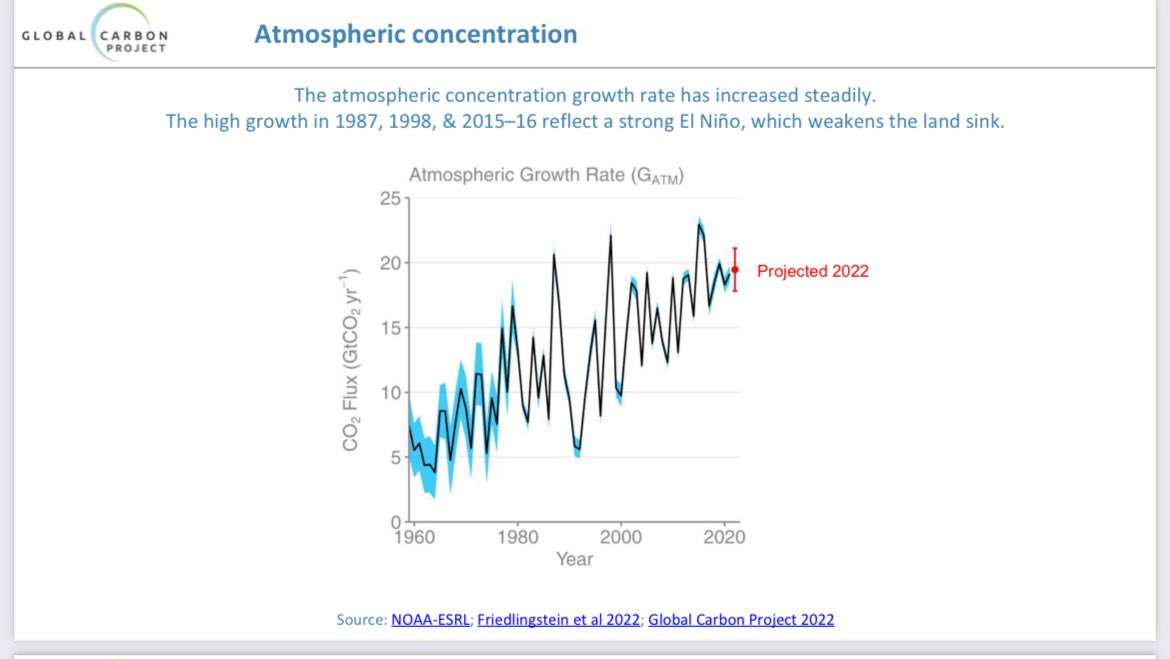
The elevated temperatures caused by the warming of the Pacific during El Niño increase carbon emissions from many living things through higher rates of cellular respiration and decomposition. Similarly, forest dieback and reduced photosynthesis occur` during periods of extreme heat and drought such as that experienced in the Amazon this year. This reduction in productivity could last for a few years after the period of drought. The current drought in the Amazon will likely take a year or two to dissipate. During the previous El Niño of 2015-2016 the carbon balance of the Basin was indistinguishable from zero. This process in the Amazon is one of the things that can keep me awake at night.
As we countdown to COP28, it is important to remember the pledges that were made at COP26 in Glasgow. World “leaders” promised to take bold action to limit global heating, including reducing deforestation and slashing methane emissions. Two years later none of these pledges are on track. Deforestation has increased in many regions and there has been no global decline of 10% needed to get to zero by 2030. Methane emissions are increasing and set to take a huge leap as LNG processing and export facilities kick into high gear in the US Gulf and Qatar. The lack of enforcement of pledges through tough regulation of the fossil fuel industry makes any promised reduction a farce. We can expect more of the same at COP28.
Nature provides 7 charts to help us understand the rapidly disappearing chances to limit global heating to 1.5˚C above preindustrial.
Author’s note: This will be my last update until after the December holiday. I hope my students can have a safe and happy break from classes. Stay positive and recognize that collectively you have the power to turn this around. I will see you again next year. – ssm 25 November 2023.

You must be logged in to post a comment.